3.4.2Management Board Remuneration in 2018
The actual remuneration for 20181 is set out hereafter in five sections, namely 1. Base Salary, 2. Short-Term Incentive, 3. Value Creation Stake, 4. Long-Term Incentive and 5. Pension and Benefits. After these sections more insight is provided into the pay ratio of the Management Board members against the rest of the organization. The actual remuneration for 2018 is combined in the table Remuneration of the Management Board by member.
Remuneration of the Management Board by member
|
Bruno Chabas |
Douglas Wood |
Philippe Barril |
Erik Lagendijk |
Total |
||||||
|---|---|---|---|---|---|---|---|---|---|---|
|
in thousands of EUR1 |
2018 |
2017 |
2018 |
2017 |
2018 |
2017 |
2018 |
2017 |
2018 |
2017 |
|
Base salary |
800 |
747 |
450 |
440 |
551 |
514 |
450 |
382 |
2,251 |
2,083 |
|
STI |
1,165 |
1,489 |
491 |
642 |
601 |
803 |
491 |
597 |
2,748 |
3,532 |
|
LTI |
1,470 |
1,665 |
836 |
709 |
740 |
1,004 |
712 |
833 |
3,758 |
4,210 |
|
Value Creation Stake2 |
1,508 |
0 |
848 |
0 |
1,038 |
0 |
848 |
0 |
4,244 |
0 |
|
Pensions |
245 |
245 |
113 |
110 |
138 |
138 |
113 |
102 |
608 |
595 |
|
Other |
165 |
284 |
39 |
41 |
146 |
147 |
38 |
37 |
389 |
510 |
|
Total Remuneration |
5,353 |
4,431 |
2,778 |
1,942 |
3,215 |
2,606 |
2,652 |
1,951 |
13,997 |
10,930 |
|
in thousands of US$ |
6,321 |
5,005 |
3,281 |
2,193 |
3,796 |
2,944 |
3,132 |
2,204 |
16,530 |
12,347 |
- 1 Peter van Rossum retired as Management Board member during the extraordinary meeting of shareholders of November 30, 2016 and his contract ended at the Annual General Meeting of April 13, 2017. His total remuneration in 2018 amounts to EUR 19k.
- 2 In 2018 a Value Creation Stake was granted under the new remuneration policy. Under the previous policy, RP 2015, the LTI is paid out after a three-year vesting period. This explains why both long term incentive plans are visible in the 2018 and 2019 Remuneration Reports.
1. Base Salary
With the new RP 2018, Base Salary levels were updated in 2018. The 2018 and 2017 Base Salary levels are included in the table at the beginning of section 3.4.2 .
2. Short-Term Incentive
For 2018, the Supervisory Board set the following performance indicators for the STI.
- Underlying and directional EBITDA (weight: 50%)
- Order Intake (weight: 15%)
- Number of FEEDs (weight: 15%)
- Total Recordable Injury Frequency Rate (weight: 8%)
- Fleet Process Safety Management (weight: 10%)
- Sustainability (weight: 2%)
With regard to the STI performance indicators, the Supervisory Board, at recommendation of the A&RC, assessed the delivered results for each performance indicator. Realization levels per target ranged between 0% and maximum. The Supervisory Board applied a discretionary increase of the STI with 10%, considering the successful settlement of the YME case and the end of the legacy issues in Brazil. This resulted in an overall score for the STI of 146% for the CEO and 109% for the other Management Board Members. In summary, the Supervisory Board regards the performance under the Company indicators robust.
3. Value Creation Stake
After the adoption of the RP 2018, the Value Creation Stake for 2018 was granted to the Management Board. The gross annual grant value for each of the Management Board members is 1.75 times base salary. The number of shares was based on the four-year average share price (volume weighted) of EUR 12.34. The monetary value of the granted Value Creation Stake is included in the table at the top of this section. The number of shares vested under the Value Creation Stake can be found in the consolidated financial statements (see note 4.3.6 Employee Benefit Expenses ).
4. Long-Term Incentive UNDER REMUNERATION POLICY 2015 (RP 2015)
Before the RP 2018 became effective, the RP 2015 applied, which included a Long-Term Incentive (LTI) scheme. Further details on the LTI, as granted under Remuneration Policy 2015, are available for review in the 2014 Annual General Meeting section on SBM Offshore’s website and in the Remuneration Report 2017. Currently, only one LTI program is outstanding: LTI 2017-2019 granted in 2017. The LTI program granted in 2016 ended in 2018 and has therefore been determined.
LTI 2016-2018
The 2016-2018 LTI grant contained two Performance Indicators: Directional Underlying Earnings Per Share (relative weighting 60%) and Relative TSR (relative weighting 40%).
With regard to these performance indicators, the Supervisory Board, upon the recommendation of the A&RC, assessed the delivered results and has concluded that the results related to both the directional underlying EPS and to Relative TSR were realized close to maximum.
The pay-out details can be found in the table at the top of this section. The actual shareholdings of the Management Board members per the end of 2018, in which only common unconditional shares are taken into account, can be found at the end of this section in the Overview Share-Based Incentives. This overview also includes the number of conditionally granted and/or vested shares in the last few years. At the time of reporting, Bruno Chabas and Philippe Barril met the share ownership requirement which is set at an equivalent of 350% of base salary. Erik Lagendijk and Douglas Wood are still in the process of building up their share ownership requirement.
5. Pensions and benefits
Management Board members receive a pension allowance equal to 25% of their base salary for pension purposes. Since these payments are not made to a qualifying pension fund, but to the individuals, the Management Board members are individually responsible for investment of the contribution received and SBM Offshore withholds wage tax on these amounts. In addition to the above a supplementary pension arrangement is in place for the CEO. This arrangement is a defined contribution scheme and its costs are included in the table at the beginning of section 3.4.2 .
The Management Board members received several allowances in 2017. This includes a car allowance which is received by all and a housing allowance for Bruno Chabas and Philippe Barril. The value of these elements is displayed in the table ’Remuneration of the Management Board by member’, at the top of this section.
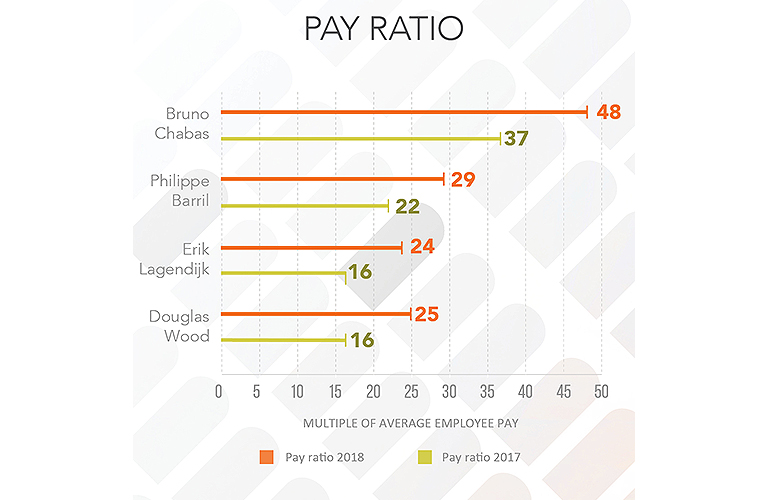
6. Pay ratios
In order to better understand the current internal pay relativities within the organization and to support future decisions on remuneration levels, the Supervisory Board reviewed several internal pay-ratios in 2018. The Supervisory Board decided that the chosen pay-ratio should be both relevant and reliable. As a result, the Supervisory Board, based on the recommendation made by the A&RC, determined the pay-ratio as the total remuneration for each of the Management Board members expressed as a multiple of the average overall employee benefit expenses (as derived from the tables in section 4.3.6 from our financial statements). The following graph displays the pay-ratios of each of the Management Board members over 2018 and 2017.